

Last Wednesday, I added another 1,500 shares of Braskem, even though it already makes up more than 15% of my portfolio.
But why? What did I actually see here?
I’ve got five reasons for this trade, though I’ll be straight with you: the debt load risk hasn’t gone anywhere. Not yet.
In this article I will present two reasons. In the next one I will present the remaining three.
Table of Contents
Petrobras naphtha as a leading indicator
The COVID playbook: tracking upstream data before the market does
Naphtha decoded: what the feedstock actually tells you
The correlation test: does naphtha predict Braskem volumes?
What 88,000 barrels per day actually means
Braskem Idesa: from problem to catalyst
Q4 utilization hits an all-time high
Why the Chapter 11 panic is overblown
The spread recovery the market is ignoring
Tracking the ships: what vessel data reveals about Q1 demand
Takeaway
1. Petrobras naphtha as a leading indicator
The COVID playbook: tracking upstream data before the market does
Let me give you some context here.
When COVID-19 hit, most investors were in full panic mode. U.S. and Chinese economic growth had stalled, global shipping had cratered. To me, the play was obvious: diagnostic companies. Names like OPKO and LabCorp, market leaders with the capacity to run millions of PCR and antigen tests.
To track how strong the quarters would actually be, I was monitoring completed tests closely. That data was publicly available, state by state, city by city.
You could also get a clean read on OPKO's revenue trajectory just by watching confirmed COVID case counts.
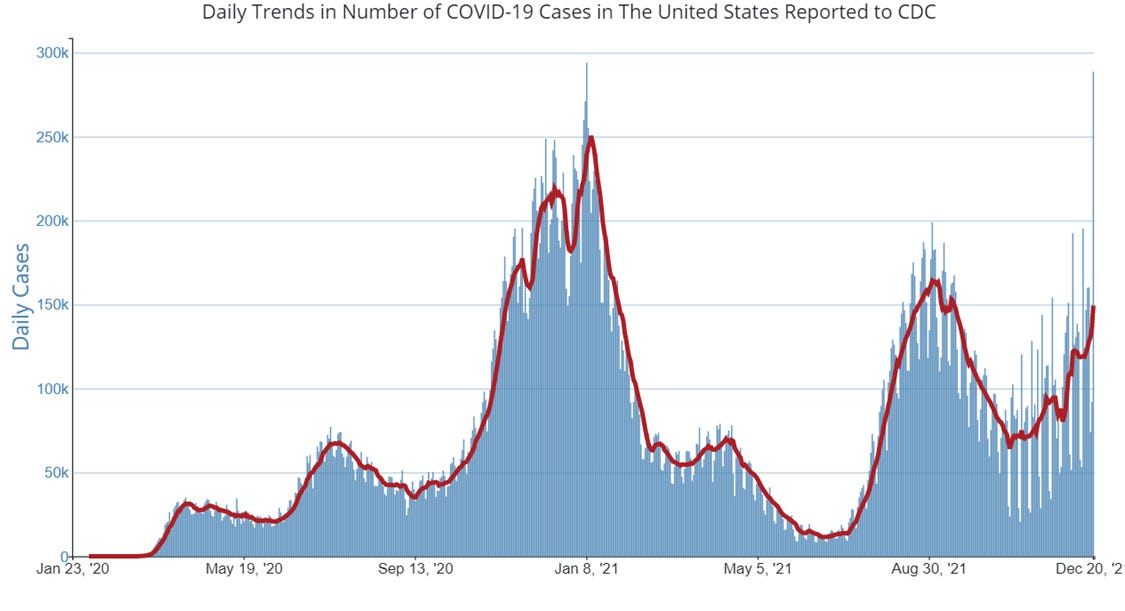
More infections meant more urgency to test, which meant bigger government budgets flowing into diagnostics. Pretty simple logic, but most people weren't paying attention to it.
Naphtha decoded: what the feedstock actually tells you
So, back to Braskem and Petrobras.
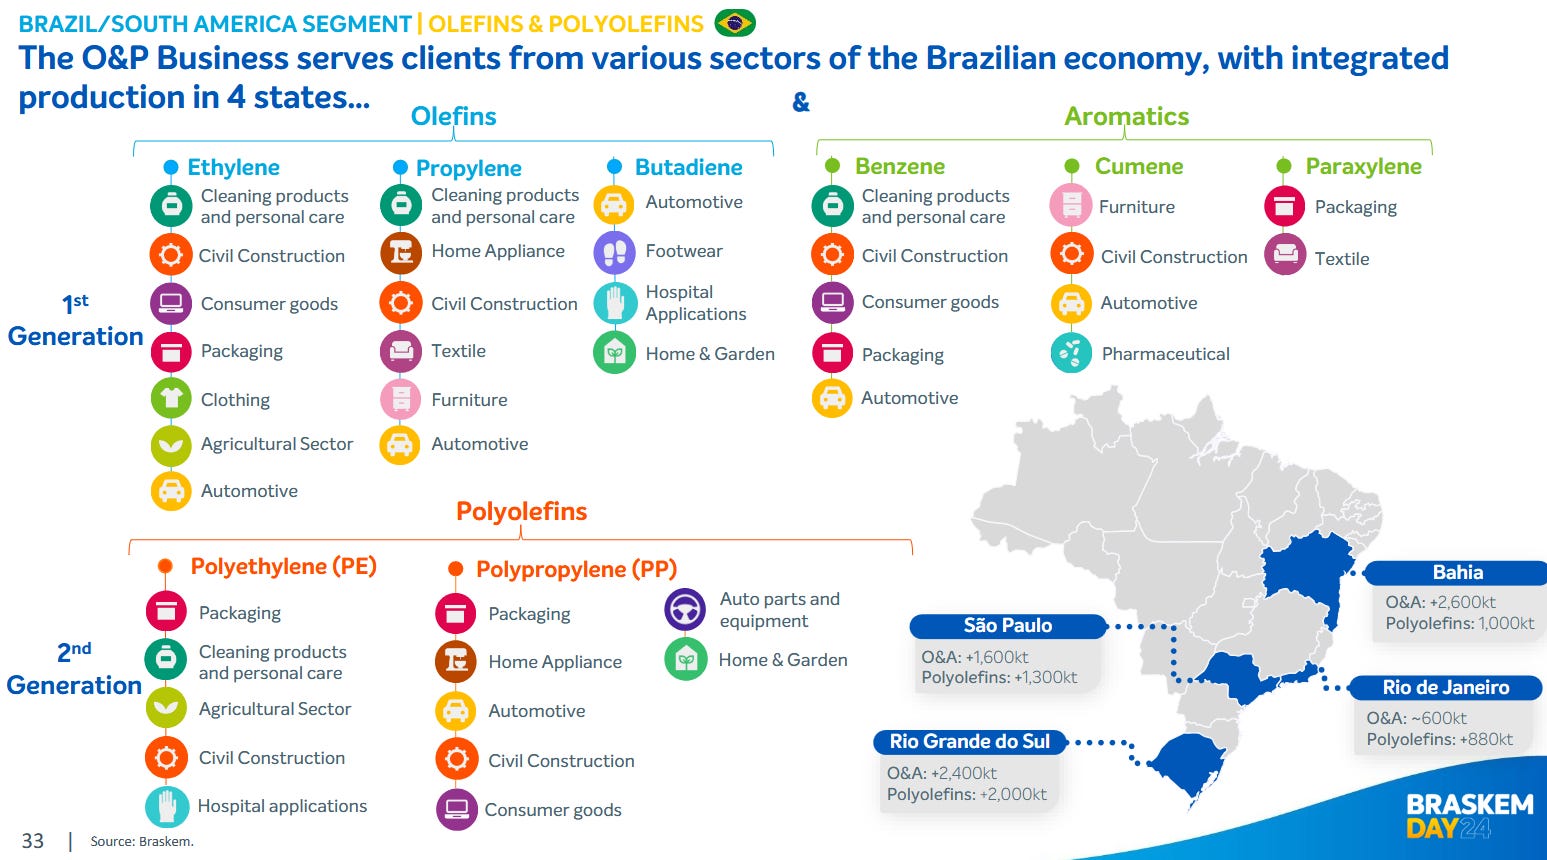
How do you actually figure out whether polymer production is growing, along with cumene, benzene, ethylene or butadiene output?
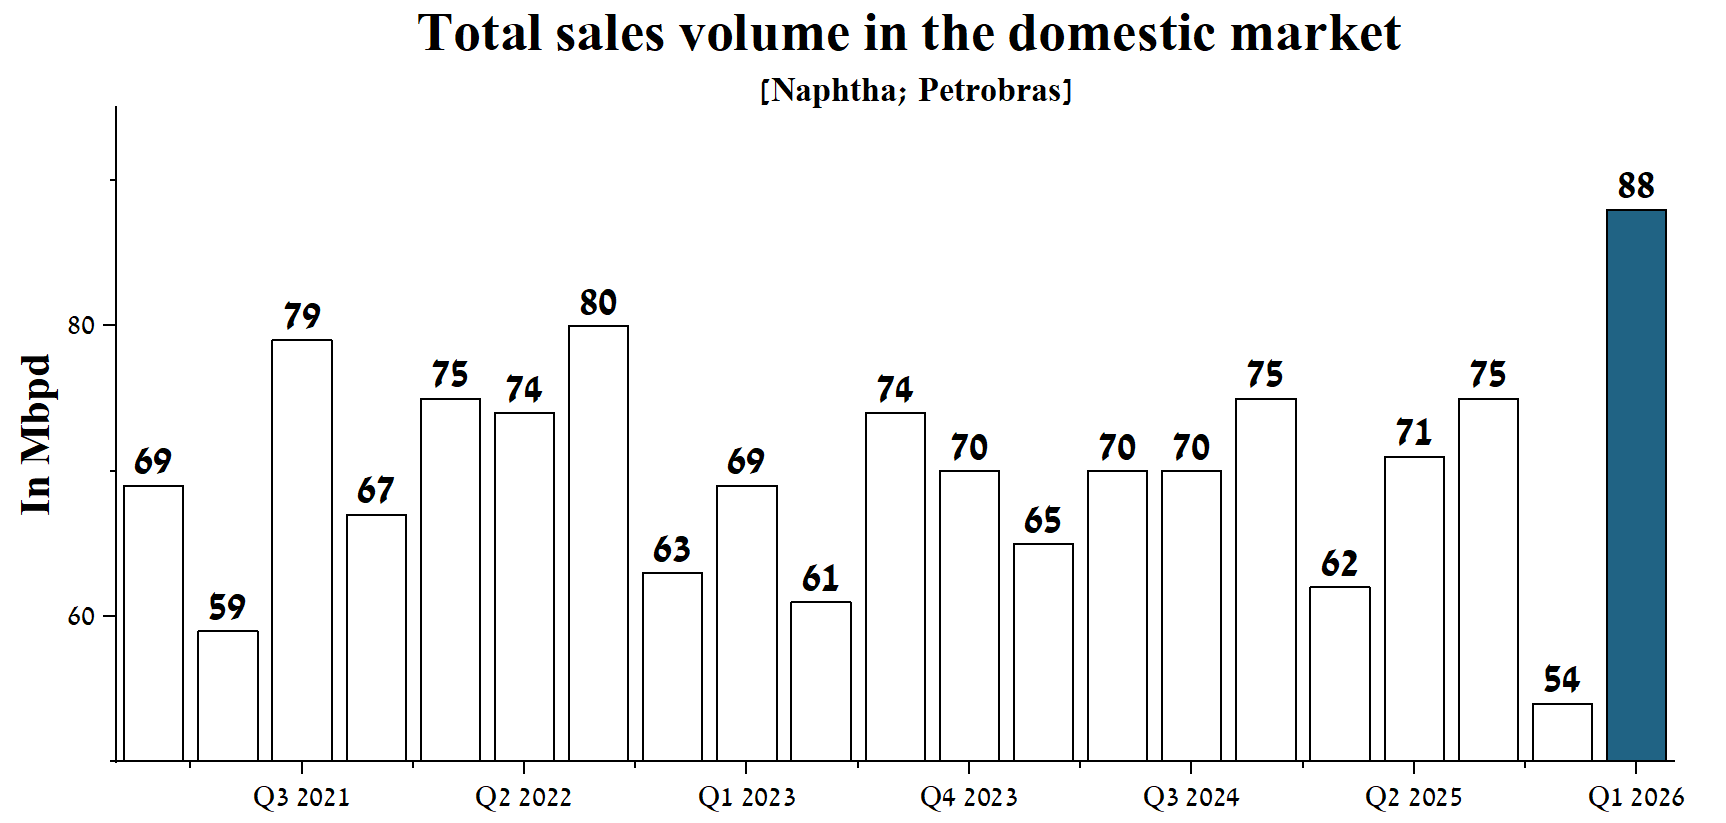
You open Petrobras’s Production and Sales Report. Specifically, you look at domestic naphtha sales in the Brazilian market.
Yes, Naphtha is the core feedstock here, but unlike ethane, it produces a wide spectrum of products with very different economics.
Braskem runs naphtha through steam cracking at 800–900°C, where long hydrocarbon chains break via a radical mechanism into a mix of lighter components: ethylene, propylene, a C4 fraction including butadiene, and heavier byproducts.
Now that we’ve established the connection between naphtha and its chemical derivatives, let’s talk about Braskem’s role here.
Braskem is Petrobras’s largest naphtha customer, which means I can say with reasonable confidence that higher naphtha sales volumes from Petrobras signal stronger demand from Braskem. I’ll verify that assumption further down.
So here’s what caught my attention.
Petrobras was selling 88,000 barrels per day of naphtha, which as you can see in the chart below is the highest volume since the pre-COVID period, when Braskem was generating billions of dollars in quarterly EBITDA. That number is up 41.9% year over year and 63% quarter over quarter.
From there, I went back to stress-test my original assumption: higher naphtha volumes equal higher polymer and “Main Chemicals” production at Braskem.
The correlation test: does naphtha predict Braskem volumes?
A quick clarification here. Most investors think of Braskem purely as South America’s dominant polyethylene, polypropylene and polyvinyl producer. That’s not the full picture. Braskem is also a leading player in the synthesis of the chemical compounds I walked through earlier.
So, in Q4 Braskem sold 647 kton of Main Chemicals [produced in Brazil / South America, sold in the Brazilian market and for export].
For context, Braskem calculates the price per ton of “Main Chemicals” using the following blend:
Ethylene at 20%, Benzene at 20%, Gasoline at 25%, Butadiene at 10%, Propylene at 10%, Cumene at 5%, Paraxylene at 5% and Toluene at 5%.
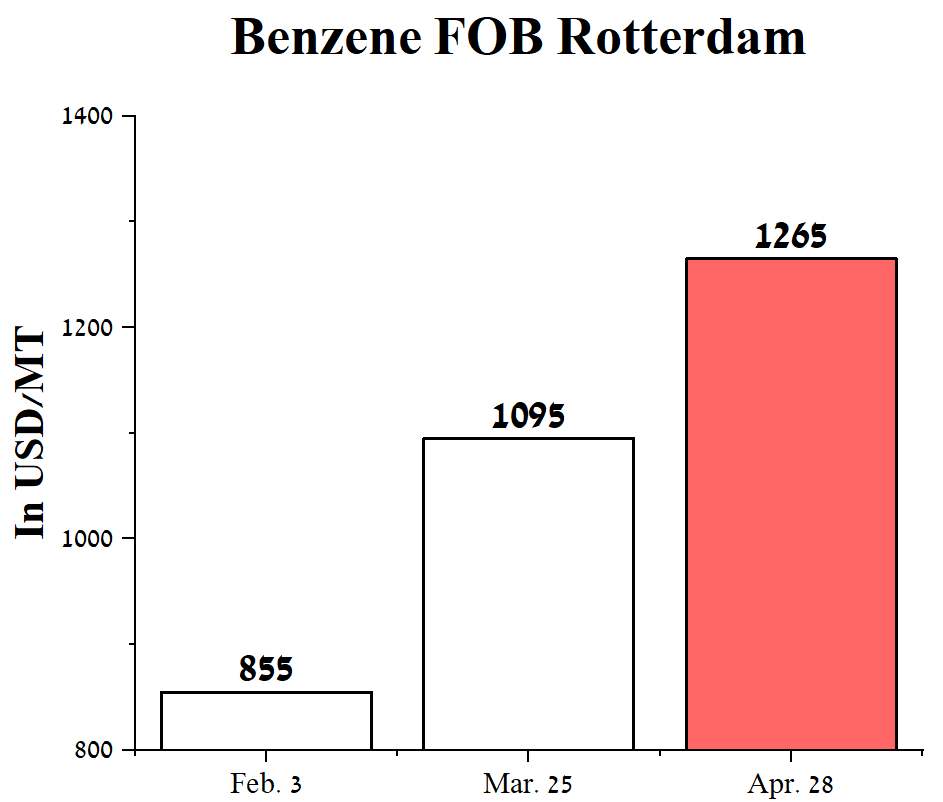
For example, the price of benzene rose from $855 per ton on February 2 to $1,265 at the end of April in Europe.
Now I want to see whether there is at least a rough correlation between Braskem’s Main Chemicals volumes and Petrobras naphtha sales.
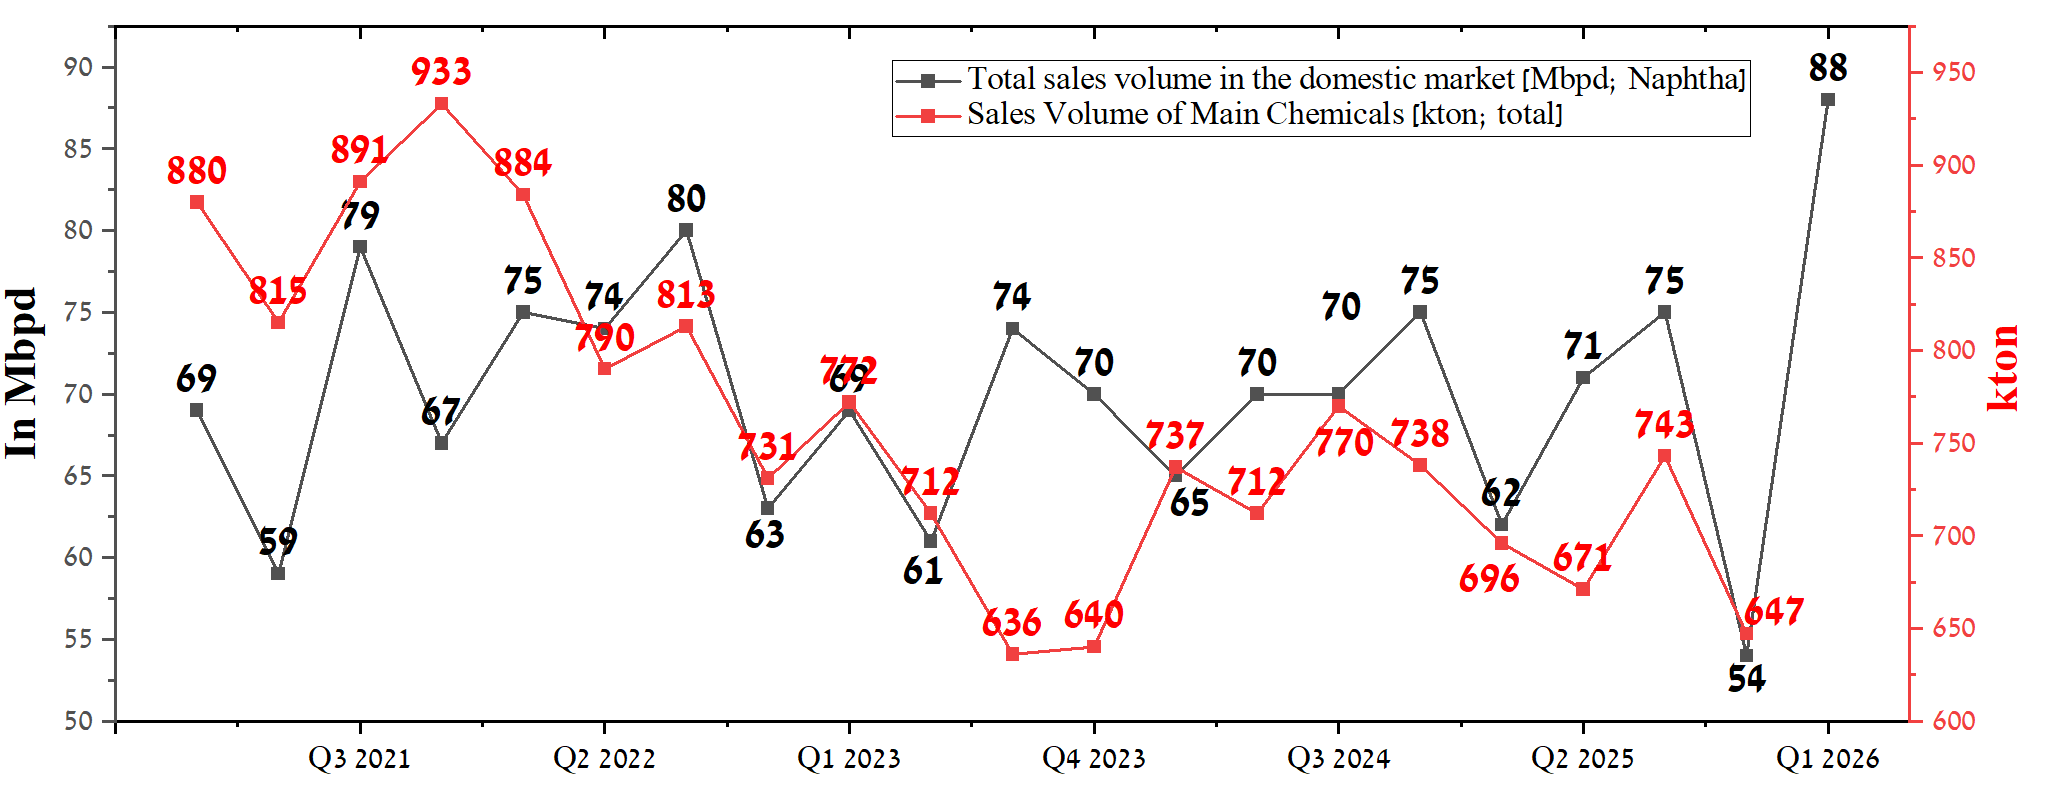
Looking purely at Main Chemicals versus naphtha, the correlation only shows up during large moves. Specifically, when quarterly naphtha sales shift by around 8 thousand barrels per day, Main Chemicals volumes tend to move by roughly 50 kilotons in the same direction.
The relationship might be cleaner if we compare Petrobras naphtha sales against Braskem’s resin volumes instead.
When naphtha growth hits the strong threshold of 8 thousand barrels per day or more, there were 4 such quarters over the period analyzed. In 3 out of 4 cases, or 75%, resin sales also posted strong growth of 50 kilotons or more: Q2 to Q3 2021 at plus 135 kilotons, Q2 to Q3 2023 at plus 190 kilotons, and Q1 to Q2 2025 at plus 58 kilotons.
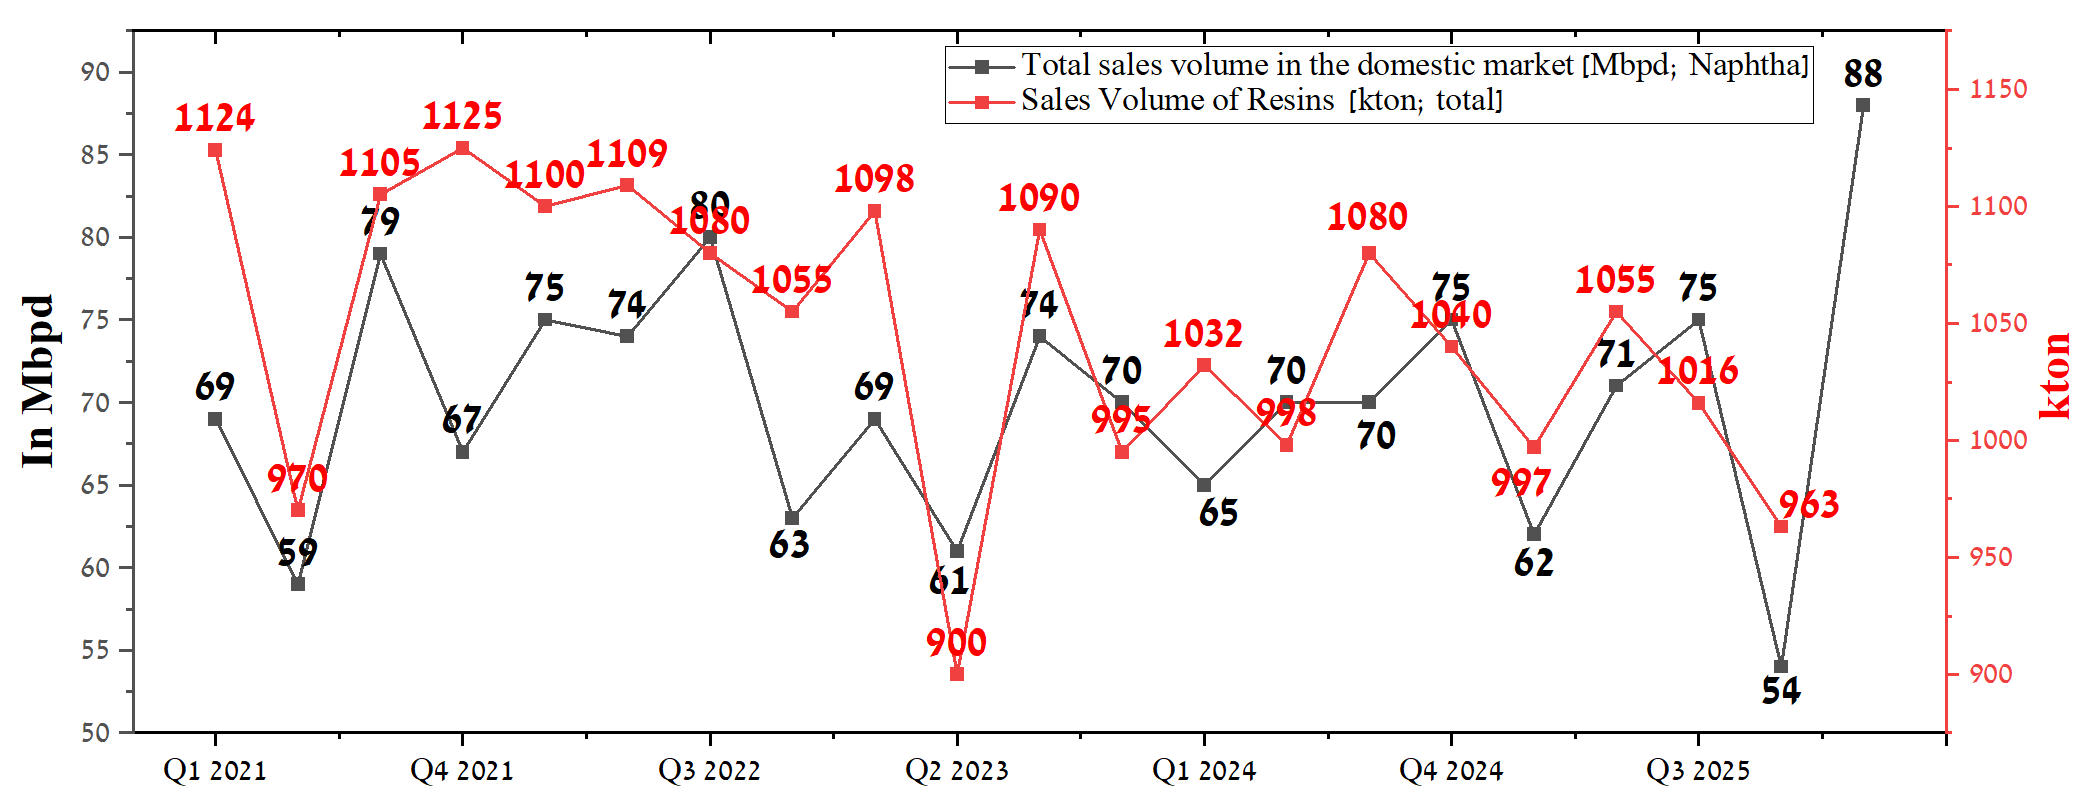
The one exception was the Q4 2021 to Q1 2022 transition, where naphtha rose 8 thousand barrels per day but resins actually declined 25 kilotons.
So strong naphtha growth is accompanied by comparable resin volume growth in the majority of cases, which points to a moderate positive relationship between the two when moves are large enough to matter.
What 88,000 barrels per day actually means
So what does 88,000 barrels per day actually tell us?
At minimum, it tells us that polymer volumes in the coming quarter are likely to come in strong relative to the 2024–2025 baseline. That’s not a bold prediction, it’s just reading the data.
When Braskem’s largest feedstock supplier is moving naphtha at the highest rate since the pre-COVID boom, you don’t need a complicated model to understand what happens downstream.
75% hit rate on a leading indicator is something most analysts would take seriously, especially when the magnitude of the move, 41.9% year over year, 63% quarter over quarter, is this large.
I'm not guaranteeing a record quarter. But with naphtha running at these levels, I'd be genuinely surprised if resin volumes don't come in strong. The data is pointing in one direction.
Most people will wait for Braskem’s quarterly release to confirm it. By then, the move has already happened.
2. Braskem Idesa: from problem to catalyst
Q4 utilization hits an all-time high
Let me start with the Q4 report.
The average utilization rate of Braskem Idesa’s polyethylene facilities hit what I estimate to be an all-time high of 92%, driven by increased ethane imports through Terminal Química Puerto México.
The result: polyethylene sales volume came in at 221 kton in Q4, up 51.4% quarter over quarter and 13.3% year over year.
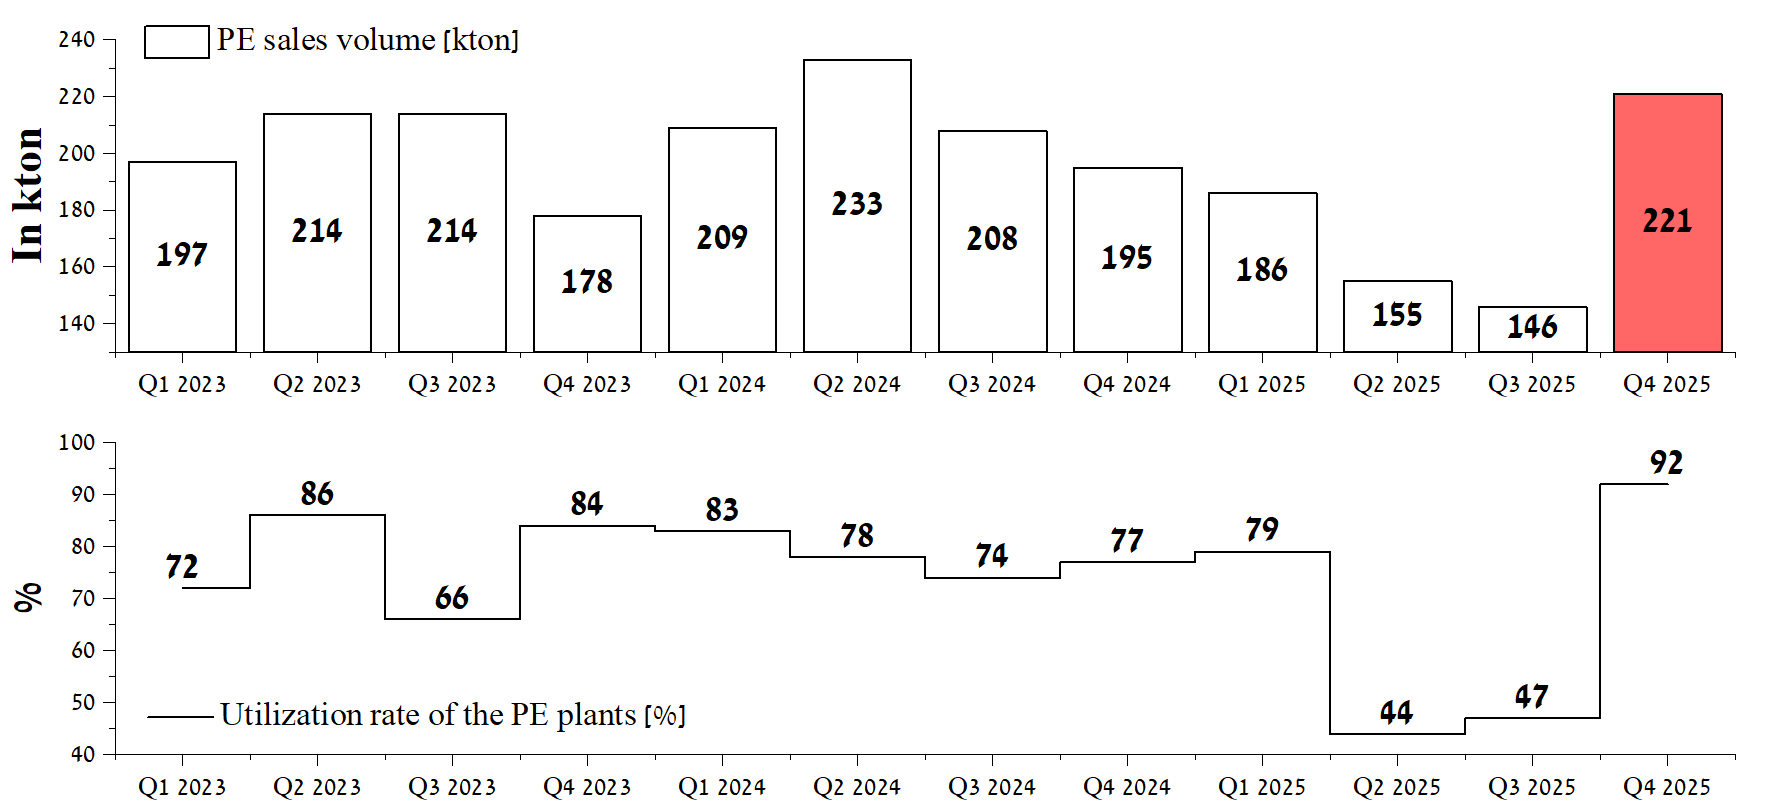
Given the closure of the Strait of Hormuz and the resulting sharp drop in polyethylene exports from Asia to Mexico, I expect Braskem Idesa to sell around 225 thousand tons in Q1 2026.
Why the Chapter 11 panic is overblown
Now, as you may recall, in early February rumors surfaced that Braskem Idesa would file for Chapter 11 due to insufficient cash to cover coupon payments on bonds maturing in 2029 and 2032. Then the Israel/U.S. war with Iran changed everything. The risk tied to their total debt of $2.6 billion as of end of 2025 hasn’t gone away.
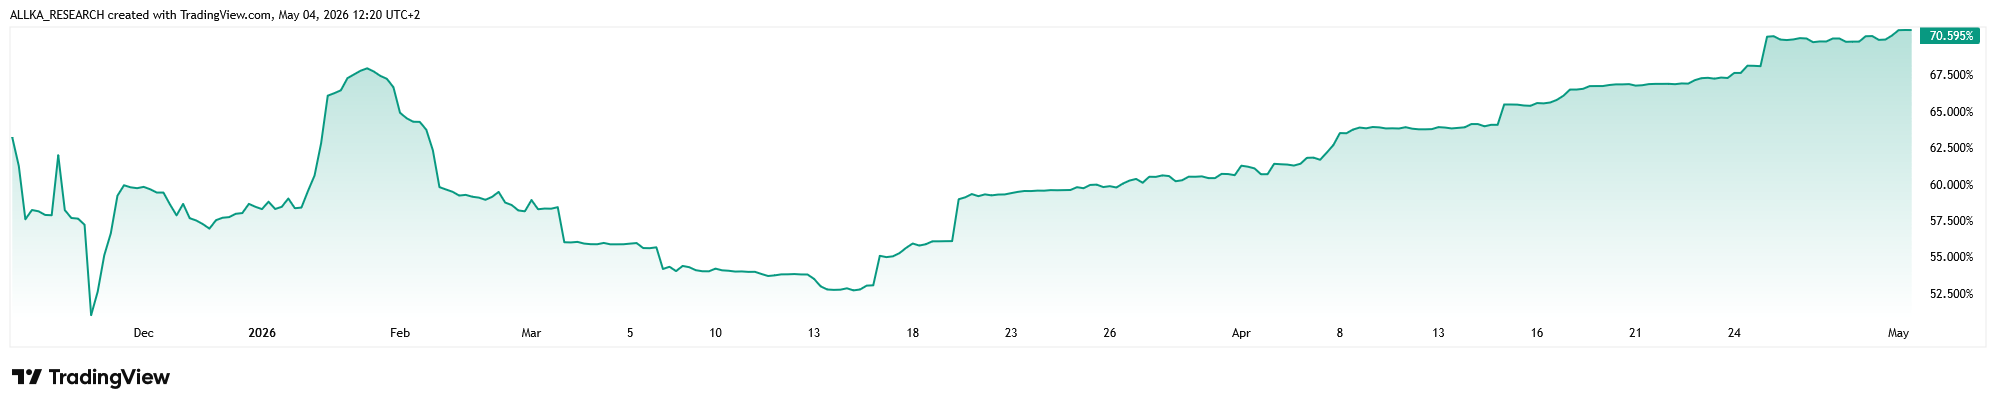
But I think the retail panic around a potential filing is overblown. Take “Braskem Idesa S.A.P.I. 7.45% 19/29” as an example: that bond has moved from 53 to around 70 as of May 4th.
In my experience studying the 2008 crisis, secured senior bonds were trading in the 50 to 60 range right before companies actually filed for Chapter 11.
There’s more.
On April 28th, ICIS reported that Petrobras CEO Magda Chambriard flew to Mexico to meet with President Claudia Sheinbaum and Pemex executives.
Then on April 30th, Sheinbaum said she expects an agreement between Pemex and Petrobras to materialize, following the Brazilian president’s partnership proposal earlier this year.
In my view, these two developments raise the probability that Braskem Idesa’s creditors, along with billionaire Slim, will help engineer a debt refinancing that keeps Chapter 11 off the table.
The spread recovery the market is ignoring
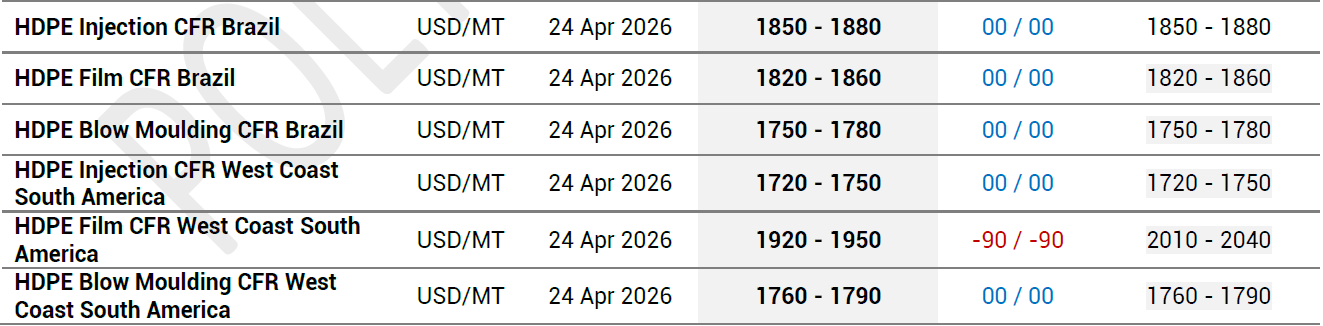
On top of that, HDPE prices in Brazil and South America have been fluctuating between $1,750 and $1,950 per ton. Meanwhile, ethylene out of Texas, which is Braskem Idesa’s supply source, is running around $750 per ton.
That puts the HDPE spread at a minimum of $1,000 per ton in Q1, compared to $625 per ton in Q4.
Tracking the ships: what vessel data reveals about Q1 demand
Then I had an idea.
I decided to track the locations of two Braskem Idesa vessels: Brilliant Future and Brave Future, using Maritime Optima data.

Starting with Brilliant Future, IMO 9987615. The vessel has been running frequent voyages. Its most recent trip was from Houston to the state of Bahia, where Braskem operates the Camaçari petrochemical complex, which runs on ethane as its primary feedstock.

But the second vessel is where it gets interesting.
Brave Future, IMO 9987627, was not making the Houston to Brazil or Mexico run. It was heading to China in mid-April.

After Brave Future offloaded in China on April 22nd, it is now heading back to Texas. I think there is a strong probability it turns around and makes another run to the same Chinese customers, who are facing a sharp supply shortage driven by the war.
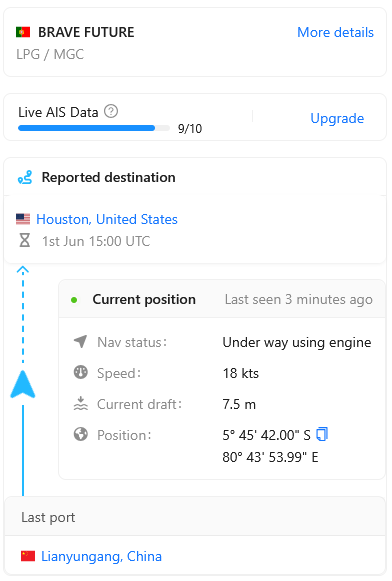
If that second voyage materializes, this stops being a one-off arbitrage and starts looking like a trade route being built in real time, ethane-based polyethylene from the U.S. Gulf Coast stepping into the void left by Asian suppliers effectively locked out of the Mexican and broader Latin American market.
We won’t have Q1 volume data until Braskem reports. But the vessel activity suggests the demand signal was strong enough to send the ship back for more. That’s not something you see in a soft market.
3. Takeaway
Braskem is priced like the worst case has already happened. The data says otherwise.
Naphtha at post-COVID highs. Braskem Idesa spreads recovering. Bonds stopped falling. Ships heading to China, not in ballast.
I’m not expecting a perfect setup. The debt load is real, and I’m not pretending it isn’t. But the market is pricing the risk, not the opportunity.
That’s where asymmetric trades live.
This is only Part 1. In the second part, I’ll walk through the remaining reasons behind my decision to add, despite the risks.
Publishing mid-week.
Disclaimer
The information provided in this publication is for informational and educational purposes only and should not be construed as financial, investment, legal, or tax advice. The views and opinions expressed are solely those of the author and are based on publicly available information believed to be reliable, but their accuracy and completeness cannot be guaranteed.
Nothing in this publication constitutes a recommendation, solicitation, or offer to buy or sell any securities, commodities, or financial instruments. Readers should conduct their own independent research and consult with a qualified financial advisor before making any investment decisions.
The author may hold positions in companies or assets mentioned in this publication and may change these positions at any time without notice. Past performance and historical trends are not reliable indicators of future results.
By reading this publication, you agree that the author and ALLKA Research shall not be held liable for any direct or indirect losses resulting from the use of the information contained herein.
Be careful with Polyéthylène.
Great work!